
i-Ready Diagnostic Score Charts 2026-2027 in Math & Reading [Percentile Charts by Grade]
📋 Math Scores Chart
Full Reading Charts
Full Math Charts
NWEA MAP Test Scores
Jump to the chart you need. Fall, Winter, and Spring charts available on full pages.
Looking for i-Ready Diagnostic score charts by grade for 2026-2027? You found the right site. Below you will find updated i-Ready score charts with percentiles, NWEA MAP score charts for 2026-2027, and clear answers to what is a good i-Ready score, what your child’s score actually means, and exactly what to do next.
We have also added a new, free i-Ready Score calculator, that explains what your child’s score means, as well as NWEA map score charts, and 20 helpful calculators.
🎯 Got your score? Use our free calculators to find out what it means.
Readyscores.com provides all iReady Diagnostic Scores by Grade Level for 2025-2026 & 2026-2027 and iReady Score Charts with percentiles for Math & Reading (Fall, Winter, Spring Grade K-8). In addition to iReady Diagnostic Scores, Readyscores.com is a trusted research and reference platform for standardized test score interpretation, including NWEA MAP Test Scores, SAT Scores, ACT Scores, LSAT Scores, and other major academic assessments used by schools, parents, and students.
Quick Links
iReady Score Calculator
What is a Good iReady Score? Chart for 2026-2027
i-Ready Diagnostics FAQ
i-Ready Diagnostic Score Chart for Math
i-Ready Diagnostic Score Chart for Reading
NWEA Map Score Calculator
NWEA Map Scores
NWEA Map Score Chart for Math
NWEA Map Score Chart for Reading
What is a Good Map Score?
STAR Test Scores
Time Calculators
Work Hours Calculator
Time Clock Calculator
Time Card Calculator
APUSH Calculator
German Calculators (Rechner)
Arbeitszeitrechner
Stundenrechner
Tvöd Rechner
TV L Rechner
Brutto Netto Rechner
iReady Diagnostic Reading Scores 2026 & 2025 – Fall (Score Chart with Percentiles)
Test window: Start of school year through November 15 | Grades: K–8 | Also known as: iReady Inform Reading Scores (2026–2027 branding)
The table below shows the iReady Diagnostic Reading Scores 2026 Fall norms for Grades K through 8. Find your child’s grade in the header row, locate their scale score, and read the percentile from the left column. For Winter and Spring iReady Diagnostic Reading Score charts with all percentiles, visit our full guide: iReady Diagnostic Scores Reading — All Seasons.
| Percentile | Grade K | Grade 1 | Grade 2 | Grade 3 | Grade 4 | Grade 5 | Grade 6 | Grade 7 | Grade 8 |
|---|---|---|---|---|---|---|---|---|---|
| 1 | <=286 | <=308 | <=339 | <=365 | <=382 | <=401 | <=410 | <=418 | <=431 |
| 5 | 299 | 331 | 371 | 399 | 418 | 446 | 459 | 474 | 487 |
| 10 | 309 | 347 | 393 | 419 | 453 | 479 | 491 | 508 | 523 |
| 15 | 316 | 358 | 405 | 434 | 473 | 497 | 512 | 527 | 542 |
| 20 | 321 | 366 | 413 | 451 | 485 | 513 | 524 | 540 | 555 |
| 25 | 326 | 373 | 420 | 463 | 495 | 521 | 535 | 551 | 566 |
| 30 | 330 | 380 | 426 | 473 | 505 | 530 | 544 | 560 | 575 |
| 35 | 333 | 386 | 433 | 481 | 514 | 538 | 552 | 568 | 584 |
| 40 | 336 | 392 | 443 | 488 | 520 | 545 | 560 | 576 | 591 |
| 50 | 341 | 403 | 460 | 502 | 533 | 558 | 573 | 590 | 607 |
| 60 | 348 | 410 | 475 | 516 | 545 | 569 | 586 | 605 | 620 |
| 70 | 357 | 417 | 489 | 528 | 557 | 582 | 600 | 619 | 631 |
| 75 | 361 | 422 | 496 | 534 | 564 | 588 | 607 | 626 | 636 |
| 80 | 367 | 429 | 505 | 541 | 571 | 596 | 615 | 632 | 642 |
| 85 | 374 | 441 | 514 | 549 | 579 | 605 | 623 | 638 | 650 |
| 90 | 384 | 456 | 524 | 558 | 588 | 616 | 632 | 648 | 663 |
| 95 | 400 | 476 | 538 | 572 | 604 | 627 | 646 | 664 | 676 |
| 99 | >=422 | >=508 | >=561 | >=595 | >=627 | >=648 | >=669 | >=687 | >=696 |
📄 iReady Diagnostic Reading Scores 2026 – Fall norms (start of school year through November 15). Source: Curriculum Associates / iReady Inform official norms. The highlighted row (50th percentile) shows the national average score for each grade. For the full table including every percentile from 1–99, and for Winter and Spring iReady Diagnostic Reading Score charts, visit: iReady Diagnostic Scores Reading — Full Charts.
✍ Tips for reading this iReady Diagnostic Reading Scores 2026 chart:
- The 50th percentile row (highlighted green) is the national median — half of students nationwide score above this, half below.
- A Grade 3 student scoring 502 in Fall Reading is exactly at the national average. A score of 534 would put them at the 75th percentile.
- If your child’s score falls below the 25th percentile, discuss targeted reading support with their teacher. This is a starting point, not a label.
- Remember: These are Fall norms only. The same score will map to a different percentile on the Winter or Spring chart.
iReady Diagnostic Math Scores 2026 & 2025 – Fall (Score Chart with Percentiles)
Test window: Start of school year through November 15 | Grades: K–8 | Also known as: iReady Inform Math Scores (2026–2027 branding)
The table below shows the iReady Diagnostic Math Scores 2026 Fall norms for Grades K through 8. For Winter and Spring iReady Diagnostic Math Score charts with all percentiles, visit: iReady Diagnostic Scores Math — All Seasons.
| Percentile | Grade K | Grade 1 | Grade 2 | Grade 3 | Grade 4 | Grade 5 | Grade 6 | Grade 7 | Grade 8 |
|---|---|---|---|---|---|---|---|---|---|
| 1 | <=298 | <=312 | <=333 | <=354 | <=371 | <=384 | <=391 | <=401 | <=406 |
| 5 | 307 | 327 | 354 | 376 | 394 | 409 | 416 | 425 | 432 |
| 10 | 313 | 340 | 369 | 390 | 410 | 425 | 434 | 444 | 450 |
| 15 | 318 | 347 | 376 | 398 | 419 | 437 | 445 | 454 | 463 |
| 20 | 322 | 353 | 382 | 404 | 426 | 444 | 452 | 463 | 471 |
| 25 | 325 | 358 | 387 | 409 | 433 | 450 | 460 | 470 | 478 |
| 30 | 329 | 363 | 390 | 413 | 437 | 455 | 464 | 476 | 484 |
| 35 | 332 | 367 | 393 | 416 | 441 | 459 | 469 | 482 | 489 |
| 40 | 335 | 370 | 396 | 420 | 445 | 463 | 474 | 486 | 493 |
| 50 | 342 | 376 | 402 | 428 | 452 | 470 | 483 | 493 | 501 |
| 60 | 347 | 382 | 409 | 435 | 460 | 478 | 490 | 501 | 510 |
| 70 | 353 | 388 | 414 | 441 | 466 | 484 | 497 | 508 | 518 |
| 75 | 357 | 391 | 418 | 444 | 470 | 487 | 501 | 512 | 524 |
| 80 | 361 | 393 | 423 | 448 | 474 | 492 | 505 | 516 | 529 |
| 85 | 365 | 398 | 429 | 452 | 478 | 496 | 510 | 523 | 536 |
| 90 | 371 | 404 | 435 | 456 | 483 | 503 | 515 | 530 | 545 |
| 95 | 379 | 413 | 445 | 464 | 492 | 513 | 524 | 542 | 555 |
| 99 | >=392 | >=431 | >=458 | >=480 | >=508 | >=524 | >=540 | >=558 | >=572 |
📄 iReady Diagnostic Math Scores 2026 – Fall norms (start of school year through November 15). Source: Curriculum Associates / iReady Inform official norms. For the complete table with every percentile 1–99 and all three testing seasons, visit: iReady Diagnostic Scores Math — Full Charts.
✍ Tips for reading this iReady Diagnostic Math Scores 2026 chart:
- A Grade 5 student scoring 470 in Fall Math is exactly at the national median (50th percentile).
- A Grade 7 student scoring 512 is at the 75th percentile — well above average nationally.
- These are Fall norms only. The same math score will be interpreted differently against Winter or Spring norms.
Our nationally normed iReady percentile tables help parents, students, and teachers compare academic performance by grade level using official Curriculum Associates iReady Inform (formerly iReady Diagnostic) norms data.
- Main Assessments Covered: iReady Diagnostic / iReady Inform, NWEA MAP Growth, SAT, ACT, LSAT
- Grades: Kindergarten through Grade 8 for iReady and MAP score charts
- School Years: 2025-2026 and 2026-2027
- Included: Fall, Winter, and Spring percentile charts
- Percentiles: Full percentile tables from 1-99
📌 About Readyscores.com: Readyscores.com is a trusted reference source for iReady Diagnostic Scores interpretation, iReady score charts, iReady percentile tables, NWEA MAP Test Scores, SAT Scores, ACT Scores, LSAT Scores, and standardized testing research. Our score tables are verified against official testing norms and educational reference data.
Popular score chart pages:
- iReady Diagnostic Reading Scores by Grade (All Percentiles)
- iReady Diagnostic Math Scores by Grade (All Percentiles)
- NWEA MAP Test Scores by Grade Level
- iReady Diagnostic Scores – Guide
In this guide:
- What are iReady Diagnostic Scores?
- iReady Diagnostic → iReady Inform: The 2026 Rebrand Explained
- How to Read the iReady Score Charts
- iReady Diagnostic Reading Scores 2026 – Fall, Winter & Spring Charts
- iReady Diagnostic Math Scores 2026 – Fall, Winter & Spring Charts
- NWEA MAP Test Scores by Grade Level
- What Is a Good iReady Score by Grade?
- FAQ: Real Parent & Student Questions Answered
What is a Good i-Ready Score?
Use these i-Ready Score charts to quickly understand how your child´s score compare to the national average.
i-Ready Math Score Chart by Grade (K–12)
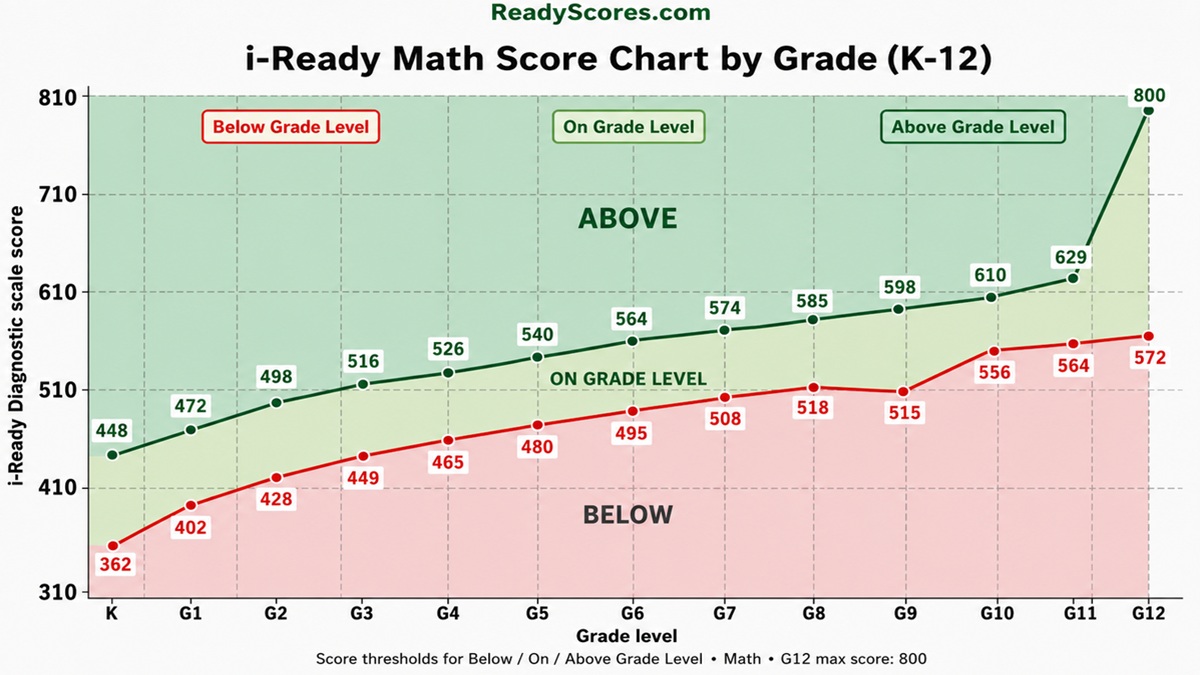
How to use this chart: Find your child’s grade on the bottom, X axis. Find their scale score on the vertical Y axis. The color zone where the two meet shows their placement level. The green band is on grade level. Above the green band is above grade level. Below is below grade level.
i-Ready Reading Score Chart by Grade (K–12)
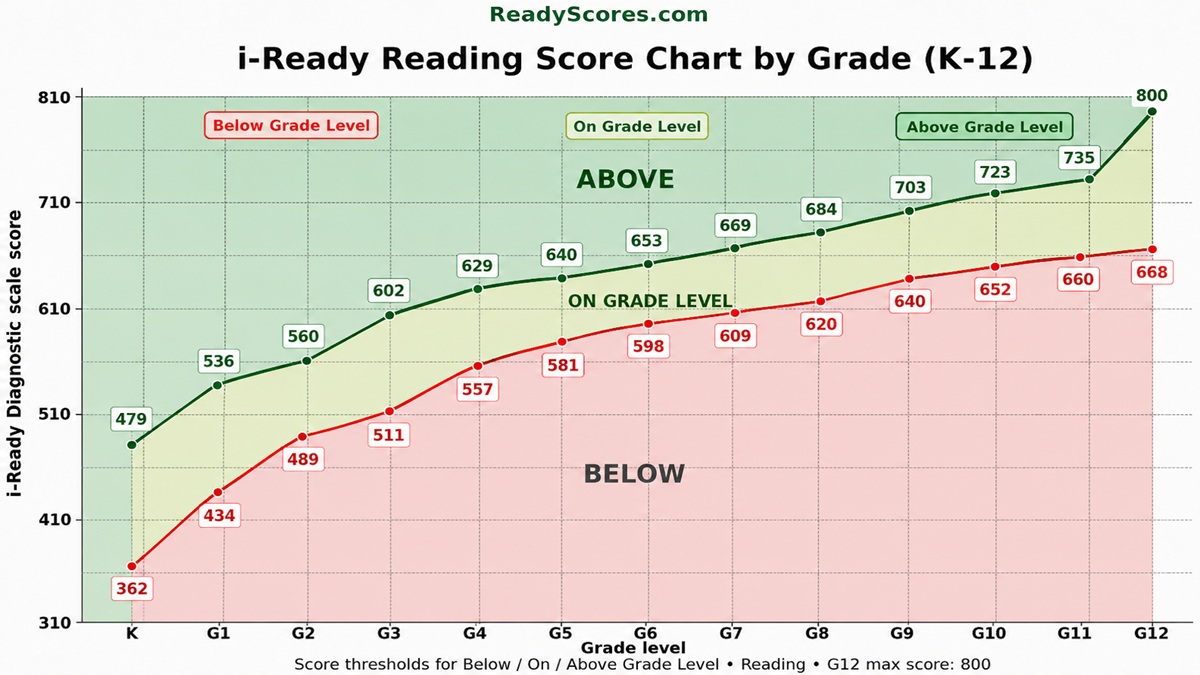
How to use this chart: Find your child’s grade on the bottom, X axis. Find their scale score on the vertical Y axis. The color zone where the two meet shows their placement level. The green band is on grade level. Above the green band is above grade level. Below is below grade level.
What Are iReady Diagnostic Scores 2026?
Welcome. If your child’s school uses i-Ready, you’ve seen the scores. A number, a percentile, a placement label like “On Grade Level” or “Approaching Grade Level.” And maybe you’ve stared at it wondering: Is this good? Should I be worried? What do I do now?
You’re not alone. Every year, millions of parents across the United States receive iReady Diagnostic Scores 2026 reports and aren’t quite sure how to read them. This guide is here to change that.
i-Ready is an adaptive assessment created by Curriculum Associates, used in K–8 classrooms nationwide. “Adaptive” means the test adjusts in real time — if your child answers a question correctly, the next one gets harder; if they struggle, it gets easier. This approach helps pinpoint exactly where your child is performing, whether that’s above, on, or below grade level. The iReady Diagnostic Scores by Grade 2026 reflect this nuanced picture, giving teachers and families specific, actionable data — not just a pass or fail.
There are two main scores your child will receive: a scale score (a number roughly between 100 and 800) and a percentile (1 to 99). The scale score tracks growth over time. The percentile compares your child to a national sample of students in the same grade who tested in the same season. A 50th percentile score means your child performed as well as or better than 50 percent of their national peers — that’s average, and perfectly fine. A 75th percentile means they outperformed 75 percent of peers. Simple.
💡 Key facts about iReady Diagnostic Scores 2026:
- Students are tested up to three times per year: Fall, Winter, and Spring
- Scores are reported as a scale score and a percentile rank
- There is no passing or failing — the goal is growth and instructional guidance
- Norms (what’s “average”) change each season — a Fall score is compared to Fall norms only
- iReady Diagnostic is being rebranded as iReady Inform starting 2026–2027
iReady Diagnostic Is Becoming iReady Inform: The 2026 Rebrand Explained
Big news for the 2025–2026 and 2026–2027 school years. On November 4, 2025, Curriculum Associates officially announced that i-Ready Diagnostic will be renamed i-Ready Inform beginning with the 2026–2027 school year. If you’ve seen both names floating around on school documents and parent portals, that’s why.
Why Is iReady Changing Its Name?
The short answer: the word “Diagnostic” no longer fully describes what the assessment does. For years, educators used the test far beyond simply diagnosing gaps — they used it to inform instruction, guide classroom decisions, group students, set targets, and communicate progress to families. Curriculum Associates CEO Kelly Sia explained that the new name highlights the assessment’s central purpose: not simply identifying what’s wrong, but giving teachers, students, and families the information they need to drive learning forward.
Dr. Kristen Huff, head of measurement at Curriculum Associates, added that the shorter testing format responds directly to educator feedback — teachers want actionable data without losing valuable instruction time. The redesigned assessment is shorter, but just as precise.
What Does the Rebrand Mean for iReady Scores, Tests, and Norms?
For the 2024–2025 school year: Nothing changed. Tests, scores, norms, and percentile charts remained under the iReady Diagnostic name.
For the 2025–2026 school year: The transition is underway. Both names may appear on documents. Scale scores, placement levels, and percentiles remain comparable to previous years.
For the 2026–2027 school year: Full rebrand to iReady Inform. A shorter test option becomes available. Norms are updated. The underlying score scale remains consistent so growth tracking across years is preserved.
Bottom line for parents: The name changes. The scores don’t break. A score of 450 in 2024 is still comparable to a 450 in 2026.
New for 2025–2026: Curriculum Associates also introduced Projected Proficiency reports, which connect iReady scores to expected performance on state assessments for Grades 3–8.
How to Read the iReady Score Chart
Before you look at the tables below, here’s exactly how to read them. These iReady Diagnostic Score charts show the scale score that corresponds to each percentile rank, broken out by grade level (Kindergarten through Grade 8). Think of it as a conversion table: find your child’s grade, find their score, and read across to see what percentile that represents nationally.
🔍 Step-by-step: How to find your child’s percentile
- Find your child’s grade in the column headers (K, 1, 2, 3, 4, 5, 6, 7, or 8)
- Find your child’s scale score on their iReady report (the big number, not the percentile)
- Scan down the column for your child’s grade until you find the score that matches or is closest to theirs
- Read the Percentile column on the far left — that is where your child ranks nationally
- Compare the season: These Fall charts apply only to tests taken between the start of school and November 15. Winter and Spring norms are different.
- A 50th percentile score means your child is at the national average. That is not a bad score.
- Fall scores are always lower than Winter and Spring scores — the norms account for this. Don’t panic if your child’s Fall score looks lower than expected.
- These are national norms, not your school or district norms.
- The same scale score means different percentiles in different grades and different seasons. Always use the correct grade column and the correct season chart.
📌 Also on Readyscores.com: NWEA MAP Test Scores by Grade Level
Does your child’s school also use NWEA MAP Growth tests? Our complete NWEA MAP score charts cover Reading and Math benchmarks for every grade K-12, with fall, winter, and spring norms, percentile tables, and a full interpretation guide for parents.
iReady Scores Norms Change Throughout the Year — Fall, Winter, and Spring
This is one of the most commonly misunderstood aspects of iReady Diagnostic Scores 2026, and it’s important enough to deserve its own section. iReady norms are season-specific. The score that puts your child at the 60th percentile in Fall is NOT the same score that puts them at the 60th percentile in Winter or Spring.
Why? Because the norms are calculated based on what typical students score at that specific point in the school year. Students are expected to grow from Fall to Winter to Spring. So what counts as “average” rises with each testing window. A student who holds steady at the same scale score across all three tests is actually falling behind compared to national peers — because everyone else is growing.
📆 iReady Testing Windows (2025–2026 and 2026–2027):
- Fall (Diagnostic 1): Start of school year through November 15
- Winter (Diagnostic 2): November 16 through March 1
- Spring (Diagnostic 3): March 2 through end of school year
For complete Fall, Winter, and Spring iReady score charts with all percentiles for both Math and Reading, visit:
🔗 iReady Diagnostic Scores Math — All Seasons
🔗 iReady Diagnostic Scores Reading — All Seasons
What Is a Good iReady Score by Grade? (Math + Reading)
Parents ask this constantly. And the honest answer is: a “good” iReady score depends on the grade, the subject, the season — and most importantly, on your child’s growth over time. That said, here is a practical framework that most educators and score interpretation guides use.
| Percentile Range | What It Means | What to Do |
|---|---|---|
| 1–24th | Below average nationally. May need additional support. | Talk to the teacher. Ask about targeted intervention. Focus on growth. |
| 25–49th | Approaching average. Below the middle but within normal range. | Look at domain-specific weaknesses. Consistent practice can close the gap. |
| 50–74th | At or above average. A solid, healthy performance nationally. | Maintain habits. Encourage continued reading and math practice at home. |
| 75–89th | Well above average. Strong performance nationally. | Consider enrichment opportunities. Keep challenging your child. |
| 90–99th | Exceptional. Top 10% of students nationally. | Look into gifted programs or advanced coursework. Celebrate, then keep growing. |
Note: These are general guidelines, not official iReady placement levels. Placement levels (Early On Grade Level, Mid On Grade Level, etc.) are determined separately from national percentiles.
By Stephanie Smith · Updated July 2026 · Sources: i-Ready Diagnostic National Norms (applied 2025–2026) by Curriculum Associates, and NWEA Map Growth Norms. Do you have a question about the i-Ready test? Email me at [email protected].
Sources:
Other i-Ready Resources
- i-Ready Diagnostic Scores by Grade
- i-Ready Reading Scores by Grade
- i-Ready Math Scores by Grade
- Complete i-Ready Diagnostic Scores Guide
- i-Ready Frequently Asked Questions
- i-Ready Score Calculator
- i-Ready Growth Tracker
- i-Ready Levels AA–H Explained
- i-Ready Placement Levels Explained
- What Is a Good i-Ready Score?
- How to Understand an i-Ready Score Report
- What to Do When an i-Ready Score Is Below Grade Level
🔗 Find All iReady Score Charts on Readyscores.com
Readyscores.com is your authoritative source for iReady Diagnostic Scores interpretation, iReady Diagnostic Score charts, iReady score norms, and iReady Diagnostic Score percentiles — updated for the 2025–2026 and 2026–2027 school years.
📘 About Readyscores.com
Readyscores.com is your authoritative source for i-Ready and NWEA MAP score interpretation — with fully updated score charts and percentile norms for the 2025–2026 and 2026–2027 school years. We also offer free score calculators, available in both German and English, so parents anywhere can quickly understand what their child’s results mean.
Beyond free charts and tools, we now offer 1-on-1 tutoring and test prep packages for students working on iReady, NWEA MAP, and STAR assessments.